In This Vignette
- What is Latex?
- Example Pivot Table
- Rendering a Pivot Table in Latex
- Rendering a Pivot Table to PDF via R Markdown
- Styling a Pivot Table in Latex
- Rendering part of a Pivot Table
- Further Reading
What is Latex?
Latex is used to write documents. Latex documents are written in plain-text that contains tags for defining the structure and formatting of the document, i.e. a different approach compared to typical WYSIWYG document editors like Microsoft Word. Latex is widely used in academia for the publishing of scientific papers.
A trivial example of a Latex document is:
\documentclass{article}
\begin{document}
Hello World!
\end{document}
For more information see Wikipedia or Latex-Tutorial.com.
A helpful reference for understanding the structure of Latex pivot tables can be found on wikibooks.
Example Pivot Table
The following pivot table is used as the basis of the examples in the rest of this vignette:
library(pivottabler)
pt <- PivotTable$new()
pt$addData(bhmtrains)
pt$addColumnDataGroups("TrainCategory")
pt$addRowDataGroups("TOC")
pt$defineCalculation(calculationName="TotalTrains", summariseExpression="n()")
pt$renderPivot()
Rendering a Pivot Table in Latex
A pivottabler pivot table can be output in Latex using
the pt$getLatex() function. The Latex for the example pivot
table above is:
library(pivottabler)
pt <- PivotTable$new()
pt$addData(bhmtrains)
pt$addColumnDataGroups("TrainCategory")
pt$addRowDataGroups("TOC")
pt$defineCalculation(calculationName="TotalTrains", summariseExpression="n()")
cat(pt$getLatex())
\begin{table}[h!]
\centering
\begin{tabular}{|l|rrr|}
\hline
& Express Passenger & Ordinary Passenger & Total\\
\hline
Arriva Trains Wales & 3079 & 830 & 3909\\
CrossCountry & 22865 & 63 & 22928\\
London Midland & 14487 & 33792 & 48279\\
Virgin Trains & 8594 & & 8594\\
Total & 49025 & 34685 & 83710\\
\hline
\end{tabular}
\end{table}The caption for the table can be specified using the
caption argument when calling the
pt$getLatex() function. The table label, used to
cross-reference the table in other parts of the document, can be
specified using the label argument. Both of these arguments
are illustrated in the examples later in this vignette.
The equivalent quick-pivot command for the example pivot table shown above is:
library(pivottabler)
cat(qlpvt(bhmtrains, "TOC", "TrainCategory", c("TotalTrains"="n()")))
More information on the quick-pivot functions can be found in the Introduction vignette.
Rendering a Pivot Table to PDF via R Markdown
R Markdown can be used to create PDF documents. R Markdown is
compiled to a PDF document using the knitr package and pandoc, via
Latex. This allows the pt$getLatex() function to be used
with R Markdown to generate tables in PDF documents.
The multirow latex package is used to allow table cells to span multiple rows. Note the header-include in the R Markdown example below.
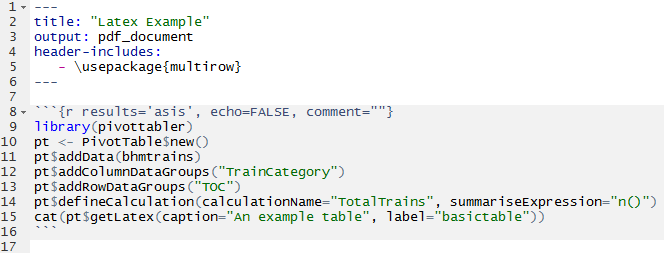
A minimal example using an R Markdown file:

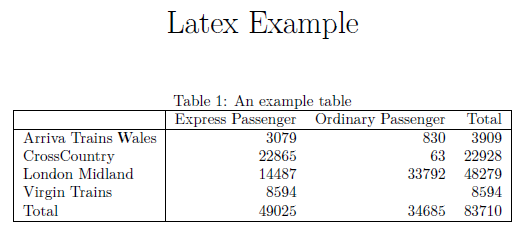
When the PDF is generated, the resulting table appears as:

When multiple row/column groups are present, additional lines are drawn within the table:

Styling a Pivot Table in Latex
Styling Latex has a great many differences compared to styling HTML.
Therefore the HTML-based approaches to styling a
pivottabler pivot table, as described in the Styling vignette, do not apply to tables
generated in Latex.
A couple of basic options for styling the pivot table headers are
offered, controlled by setting either/both of the
boldHeadings and/or italicHeadings arguments
to TRUE when calling pt$getLatex(). For
example, specifying italicHeadings=TRUE:

Rendering part of a Pivot Table
Pivot tables can easily grow to be larger than the height/width of a
single A4 page. To split a pivot table across multiple pages, the
following arguments can be specified when calling
pt$getLatex():
fromRowtoRowfromColumntoColumn
Integer numbers should be specified for these arguments. The numbers are 1-based and specify the cells in the body of the pivot table only, i.e. they do not include either the row/column headings. In the example pivot table above:
- the Arriva Trains Wales, Express Passenger cell with value 3079 is at row 1, column 1.
- the London Midland, Ordinary Passenger cell with value 33792 is at row 3, column 2.
- the Total, Total cell with value 83710 is at row 5, column 3.